Shimpaku
Seven real Junos devices run as VMs on one hypervisor, streaming telemetry every 10 seconds, and you can watch them live. Shimpaku is a Mist-style assurance system on top of them: it turns that telemetry into service levels, isolates a fault's blast radius, and lets an AI agent propose a fix, but never apply one on its own.
Live status could not be loaded here. The dashboard shows the live lab when it is online and a recorded replay when it is not; the status page has uptime.
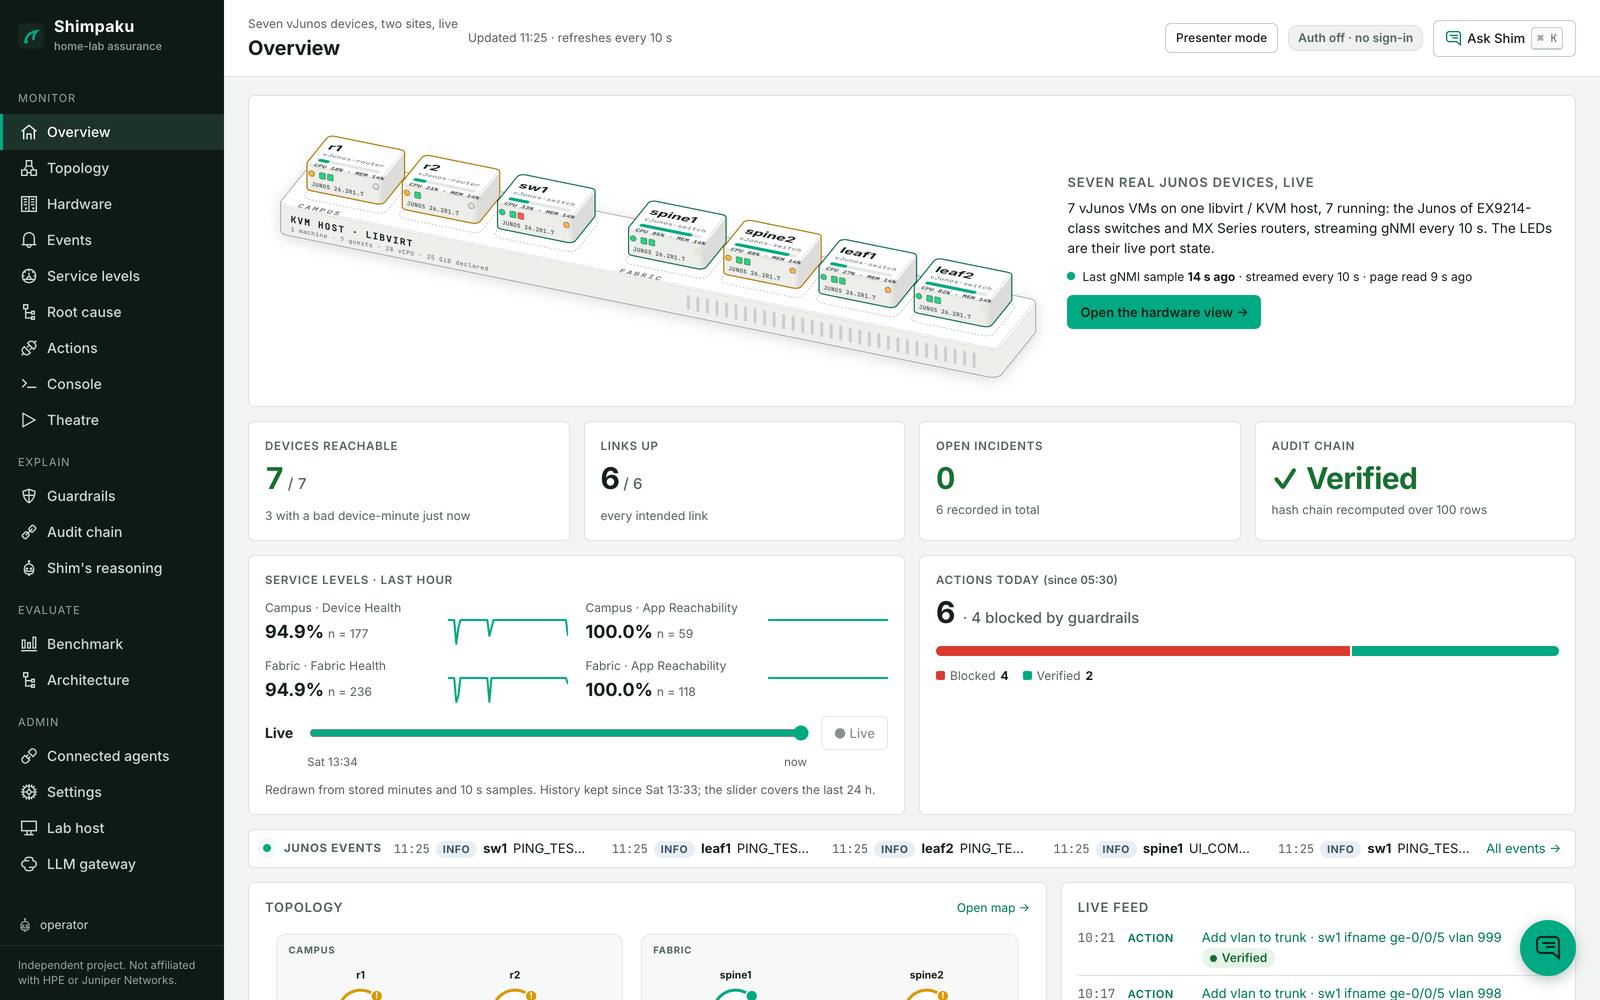
The public dashboard is a read-only replay recorded from the live lab. The switches are never reachable from the internet.
Seven real Junos devices, live
The lab is not a simulation of a network: it is seven Junos VMs on one libvirt/KVM host, a campus (r1, r2, sw1) and a two-spine, two-leaf EVPN-VXLAN fabric. Each streams gNMI telemetry every 10 seconds and answers NETCONF reads, and every number on the dashboard comes from them. The dashboard's Hardware view draws each one as a front panel whose port LEDs, traffic blinks, CPU and memory are read live.
The images run the same Junos OS as real hardware, per Juniper's own documentation: vJunos-switch is built "using EX9214 as a reference Juniper switch", and vJunos-router "using vMX as a reference Juniper router", with "feature consistency with the physical MX Series platforms". What they do not have is the hardware's forwarding: the data plane is software in an x86 VM, limited to "up to 100 Mbps aggregated over all the interfaces", and Juniper says they are for labs only. (vJunos-switch, vJunos-router.)
- r1 vJunos-routercampus router
- r2 vJunos-routercampus router
- sw1 vJunos-switchaccess switch
- spine1 vJunos-switchfabric spine
- spine2 vJunos-switchfabric spine
- leaf1 vJunos-switchfabric leaf
- leaf2 vJunos-switchfabric leaf
This list is static. Live state is on the dashboard and in the status strip above.
on one KVM host, 4 vCPU and 5 GiB each as declared in the lab files: Juniper's minimum
gNMI dial-in telemetry from every device, plus NETCONF reads; no SNMP
the reference platforms Juniper names for vJunos-switch and vJunos-router
The write path is the product
- ProposeAn agent (Claude Code, OpenCode, or the built-in assistant) calls an MCP tool.
- GuardrailsTen checks in Python, over live device facts, not prompt rules.
- Human approvalOnly a dashboard session can approve. It is not an MCP tool.
- commit confirmedPer-device lock; confirmed only after a fresh health check. If the executor dies, Junos rolls back.
- ValidateThe symptom is watched for a window. If it comes back, the action is marked recurred.
Break it, watch it get fixed
commit confirmed,
health-checked from a fresh session and confirmed, then watched for a validation window until it reads
Verified. Every step carries its recorded time.The same thing as text
- Fault injected: VLAN 999 removed from the sw1 ge-0/0/5 trunk; the trunk turns red.
- A fix is proposed (by a tester's session here); ten guardrail checks pass, each shown as a tick.
- It is approved; the executor commits with
commit confirmed. - A fresh-session health check passes, the commit is confirmed, the trunk turns green.
- A countdown runs through the validation window, then the run is marked Verified.
Recorded from a real run on 2026-10-25 against the vJunos lab, action act-20261025-838aed: first dip 9.5 s after the fault, commit confirmed in 16 s, 180 s validation window, Verified. Gaps over 12 s are fast-forwarded and labelled in the clip. No incident opened, because the fault was too brief.
Evidence, run on the live lab
unsafe actions executed in a live red team: forged approvals, wildcard and interface-range smuggling, fabric-link disables
fault-injection harness trials (16 scenarios × 5): inject, verify independently, revert, verify the revert
measured Junos self-rollback after killing the executor mid-change
defects found by running it, each written up with its fix and test, including one false "verified"
What it is, and is not
| Built | Deliberately not built |
|---|---|
Service levels in probe-minutes, with n beside every percentage | Wi-Fi capacity SLEs: virtual radios report no retries |
| Blast-radius isolation with a significance gate | LSTM anomaly detection: a rate test beat it on false alarms (simulated data) |
| One MCP server as the only path to a device, hash-chained audit | Any connection to a real Mist account, its data or its look |
| A fault benchmark whose ground truth the system cannot read | A scored detection result, which is the next milestone |